Reports and dashboards in ActiveQ
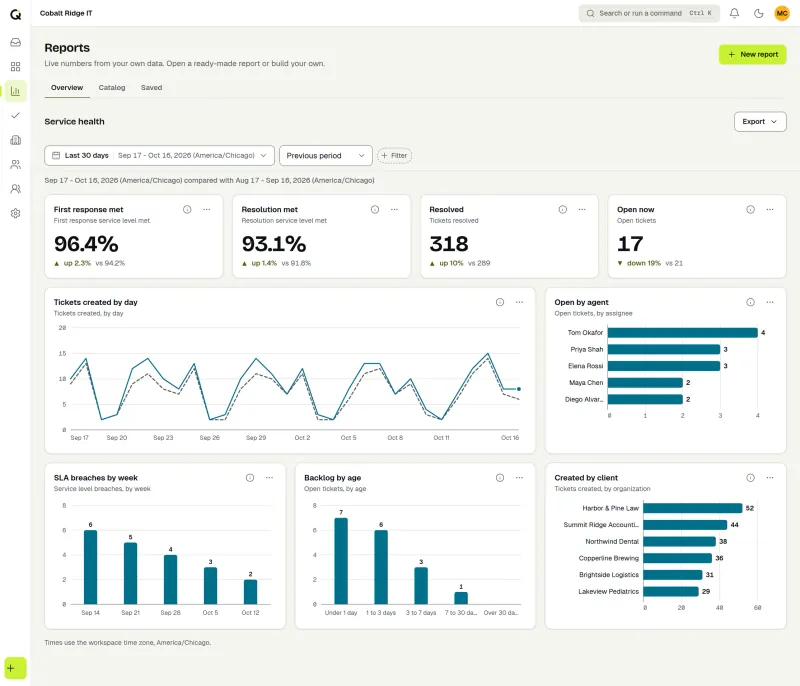
Every workspace gets 19 ready-made reports and a builder with 30 metrics, covering SLA performance, backlog, workload by technician, satisfaction and more. A report is a dashboard of charts and tables with a date range and filters, and you can save it, share it with your workspace or export it as a PNG graphic, a PDF or a CSV file.
Start 14-day trialSee pricingNo card required. Sign-up is for US businesses.
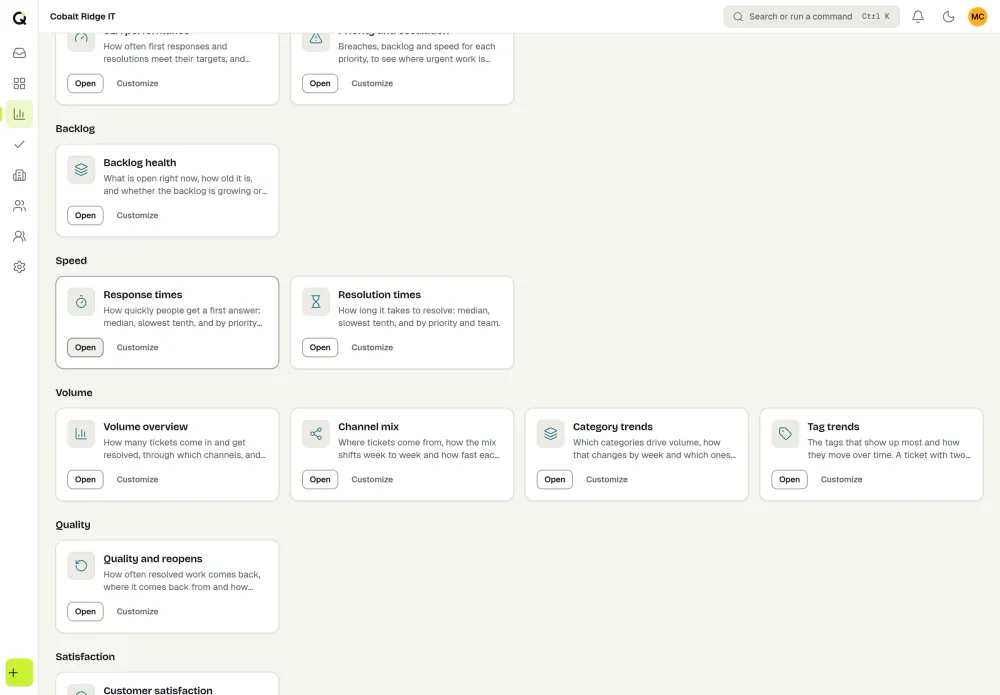
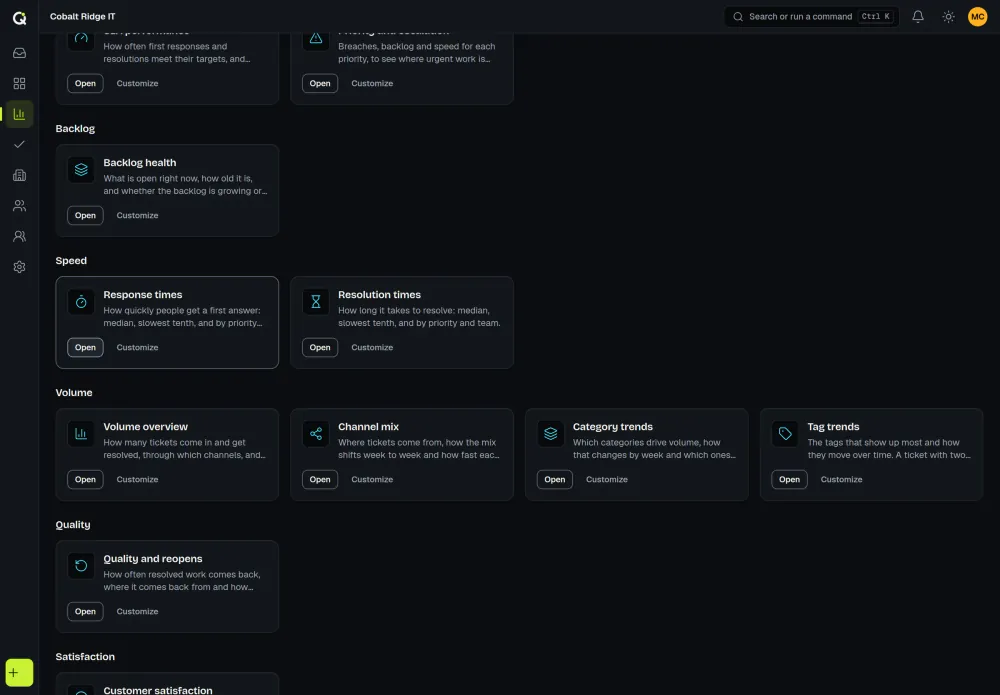
19 ready-made reports
Each report opens read-only, with a date range and filters you can change. Choose Customize to copy it into a saved report of your own. The words are your workspace’s, so you’ll see requests, cases or work orders if that’s what you call them.
| Group | Reports |
|---|---|
| Overview | Weekly snapshot: the last 7 days against the period before, with eight headline numbers. |
| SLA | SLA performance (first response and resolution attainment, breaches, tickets at risk) and Priority and escalation. |
| Backlog | Backlog health: open, unassigned and without a first response, by age and by assignee. |
| Speed | Response times and Resolution times, by priority and by team, in calendar and business hours. |
| Volume | Volume overview, Channel mix, Category trends and Tag trends. |
| Quality | Quality and reopens: reopen rate and one-touch resolution. |
| Satisfaction | Customer satisfaction: average score, share satisfied and response rate, by assignee and by client organization. |
| Team | Workload by technician, Team performance and Technician scorecard. |
| Clients | Client health across organizations, and a Client report for one organization that you export and send yourself. |
| AI | AI assist usage: runs, credits and how often suggestions are accepted. Shown only to people who can manage AI or billing. |
| Knowledge base | Knowledge base impact: articles published, views and helpful rate. Shown only where the knowledge base is on and to people who may view internal articles. |
Build your own from 30 metrics
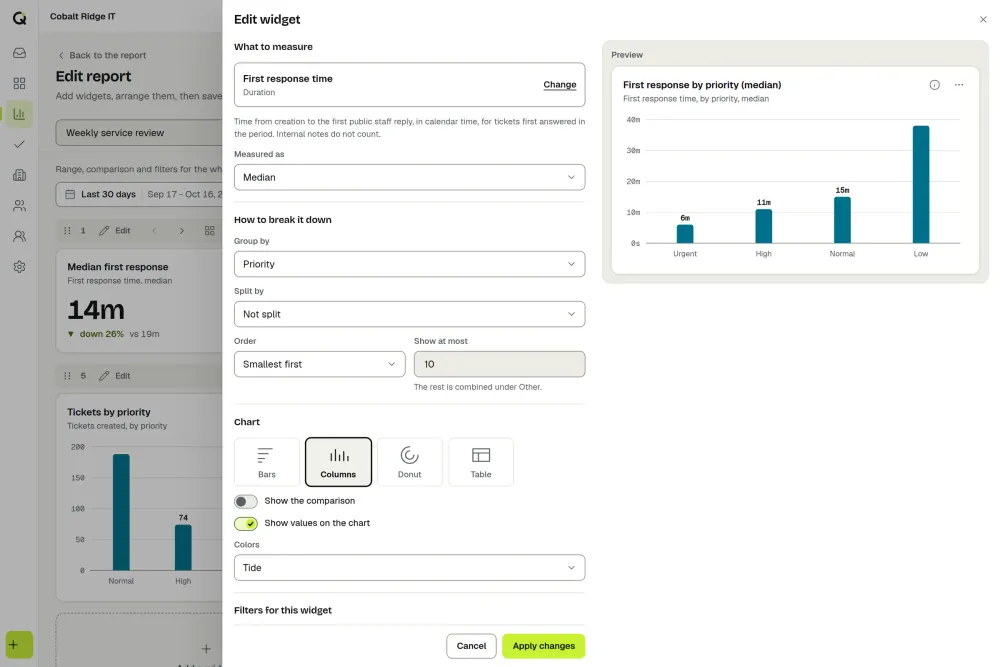
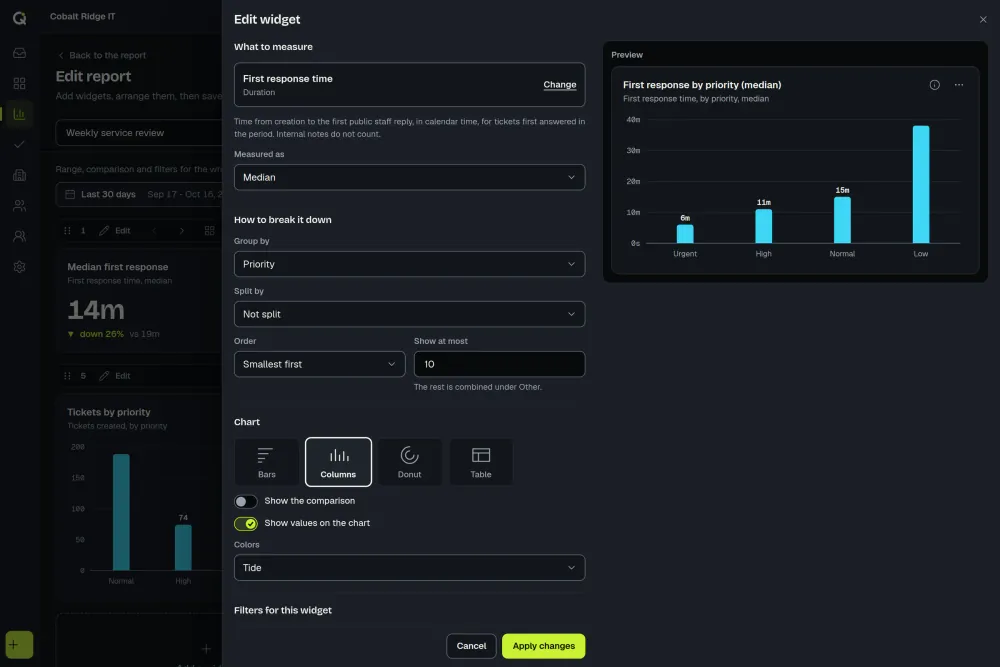
The metrics are a fixed list, so every number is defined the same way each time, and each one has a short help note that says how it is counted. They fall into eight groups. Volume covers created, resolved and closed counts and the net change in backlog. Backlog covers open work, its age, what is unassigned and what has no first response. Speed gives first response and resolution time as median, average or 90th percentile, in calendar time or business hours, and SLA gives attainment, breaches and work at risk.
Quality covers reopens, reopen rate and one-touch resolution. Satisfaction covers average score, share satisfied and response rate, from the optional portal satisfaction ratings. Workload counts replies sent and notes added, and the last group covers AI runs, credits and acceptance rate, plus knowledge base articles published, views and helpful rate.
To add a widget, pick a metric and choose how to group it (by day, week or month, weekday, hour, status, priority, channel, category, type, team, assignee, organization, tag or mailbox), how to split it, and which filters apply. Compare with the previous period, add a goal line, sort and limit the results, and pick a chart: number, line, area, bar, horizontal bar, stacked bar, donut, heatmap or table. Set each widget’s width and height, and reorder by dragging or with the keyboard.
Save, share and pin
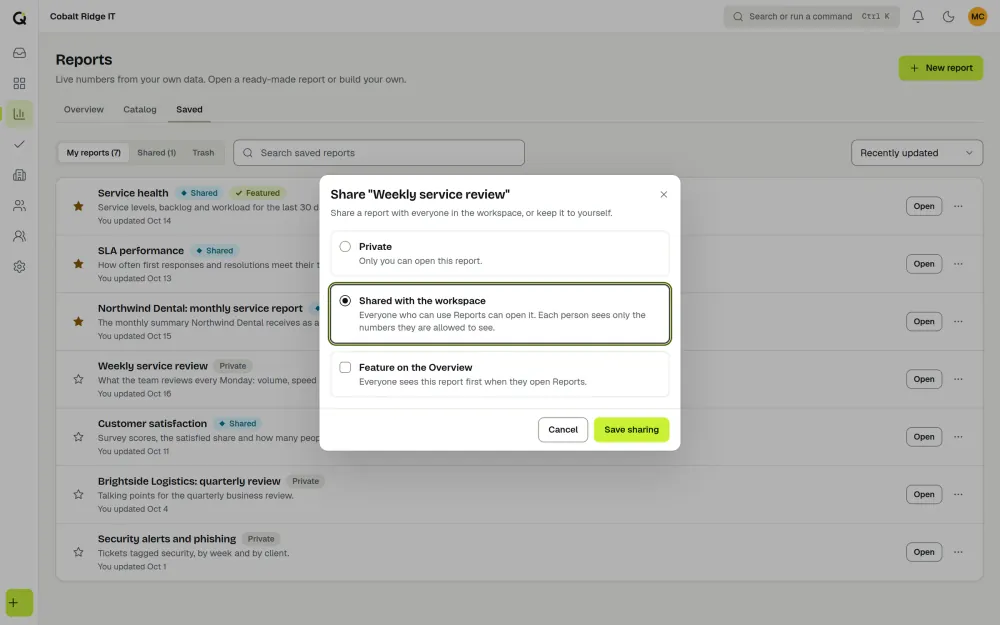
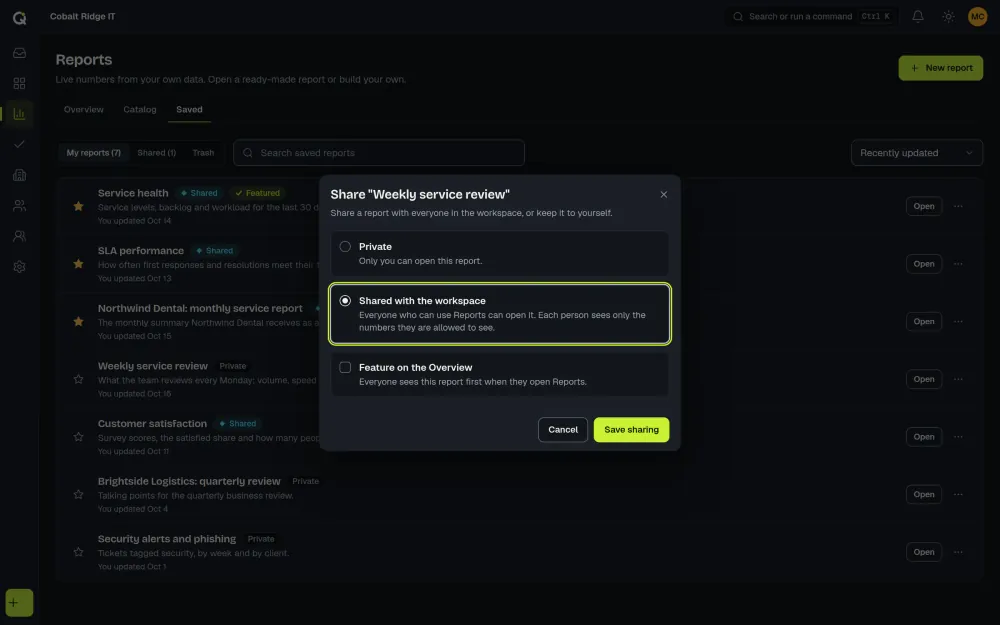
A saved report is private to you or shared with the whole workspace. If two people edit the same report, neither can overwrite the other without a warning, and a deleted report can be restored from the trash. Pin the reports you open every day, and an admin can feature a shared report so it opens first for everyone. Any report can be filtered by status, priority, channel, category, type, team, assignee, client organization, tag or mailbox.
Exports with your own layout
Exports are made in your browser from numbers you can already see, so nothing extra leaves the app.
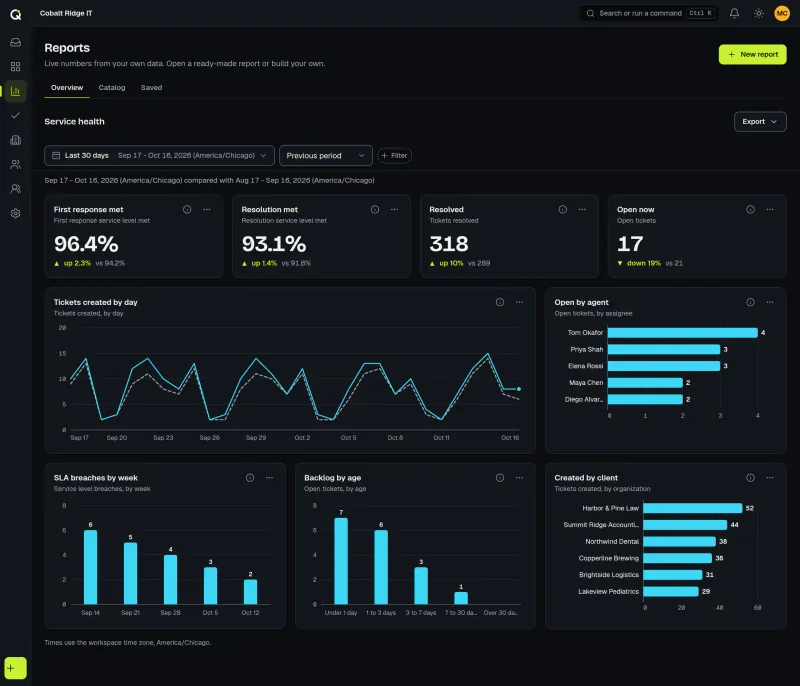
A PNG graphic exports one chart as an image in a size you choose (widescreen, 4:3, square, banner or a custom size up to 4096 pixels a side), in a light, dark or transparent theme and one of six color palettes. Turn the title, subtitle, date range, legend, value labels, logo and footer on or off, then download the image or copy it.
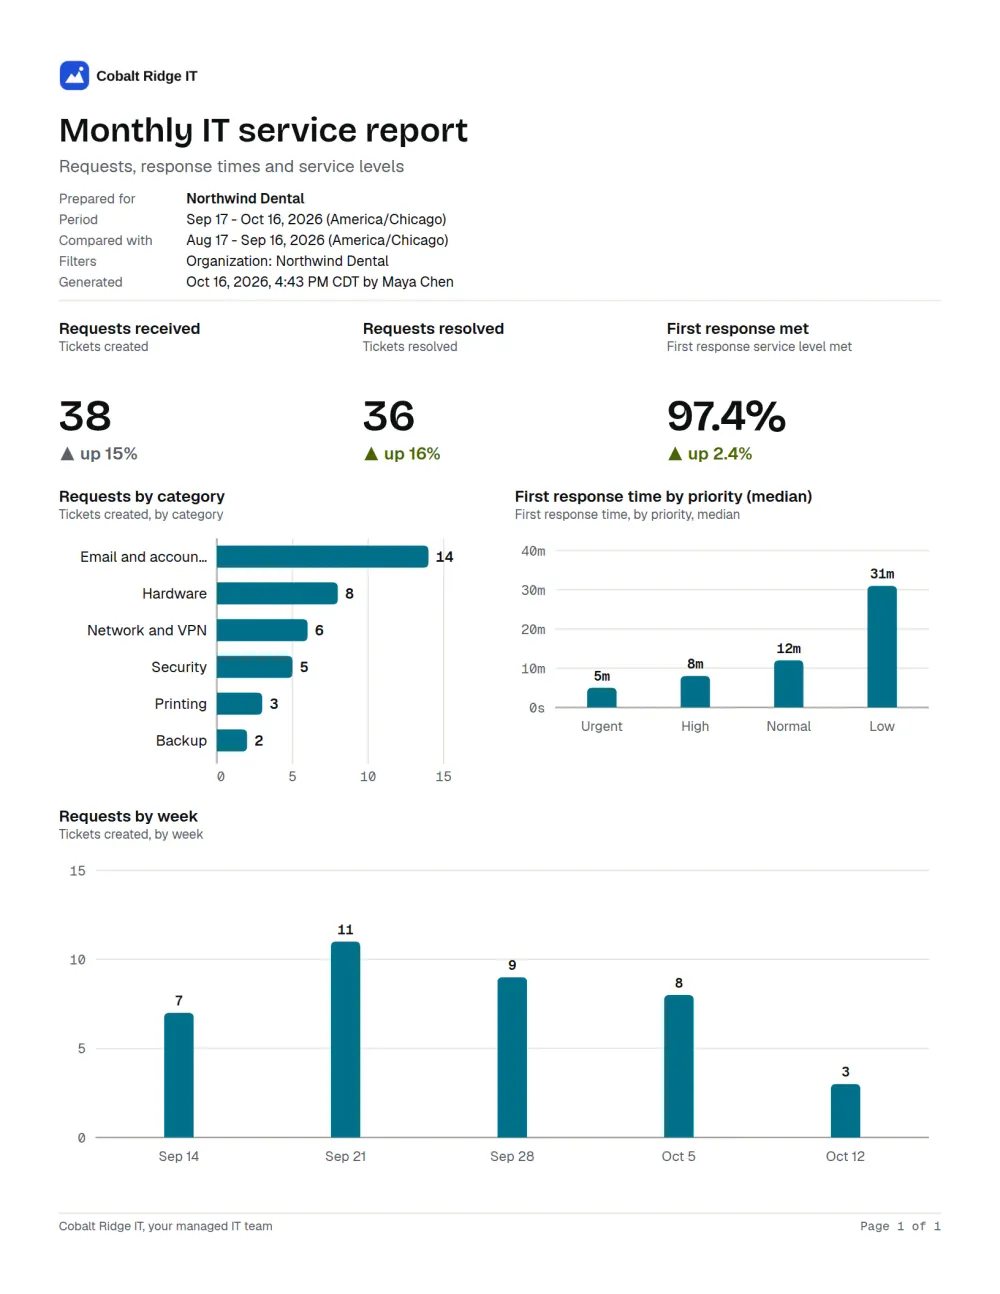
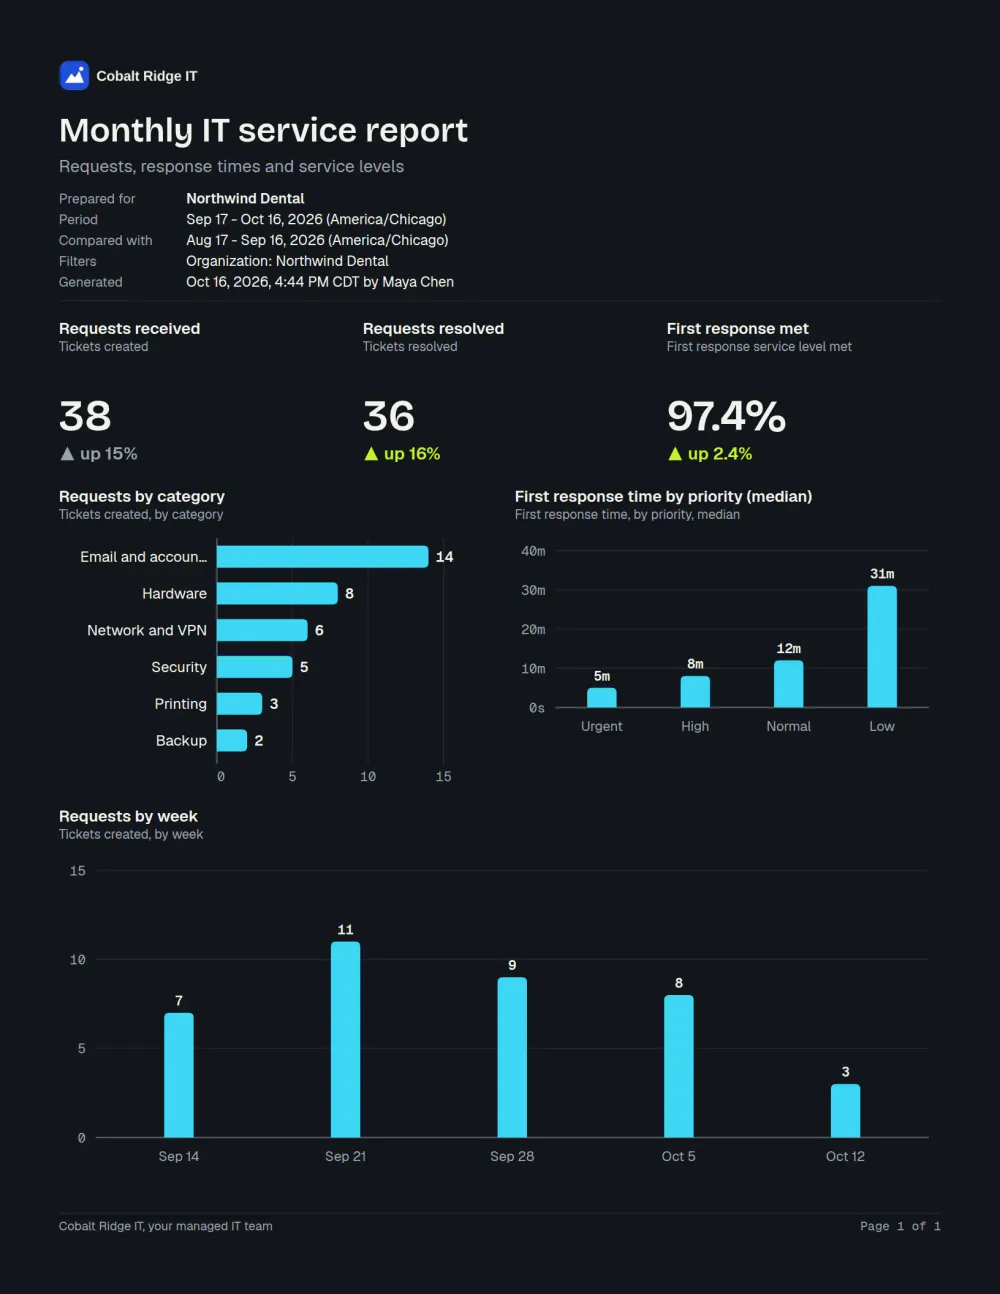
A PDF is composed the way you want it: a title, subtitle and a “Prepared for” line, your workspace logo, Letter or A4, portrait or landscape, one or two columns, the widgets you tick in the order you want, a data table under each chart, a summary of the filters, the date range, a footer line and page numbers. The layout is saved with the report.
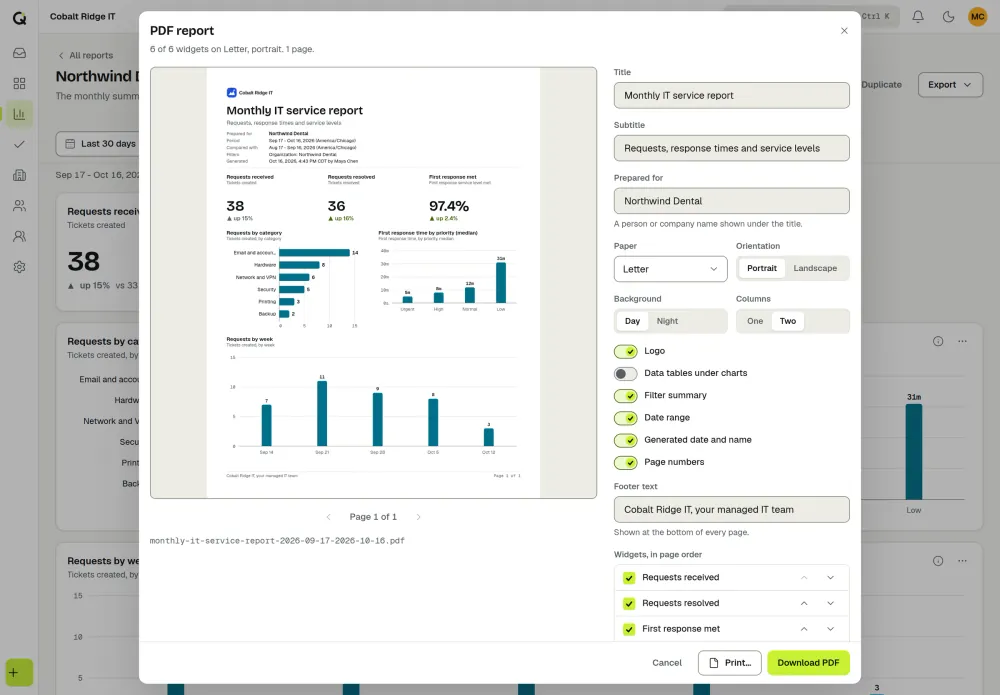
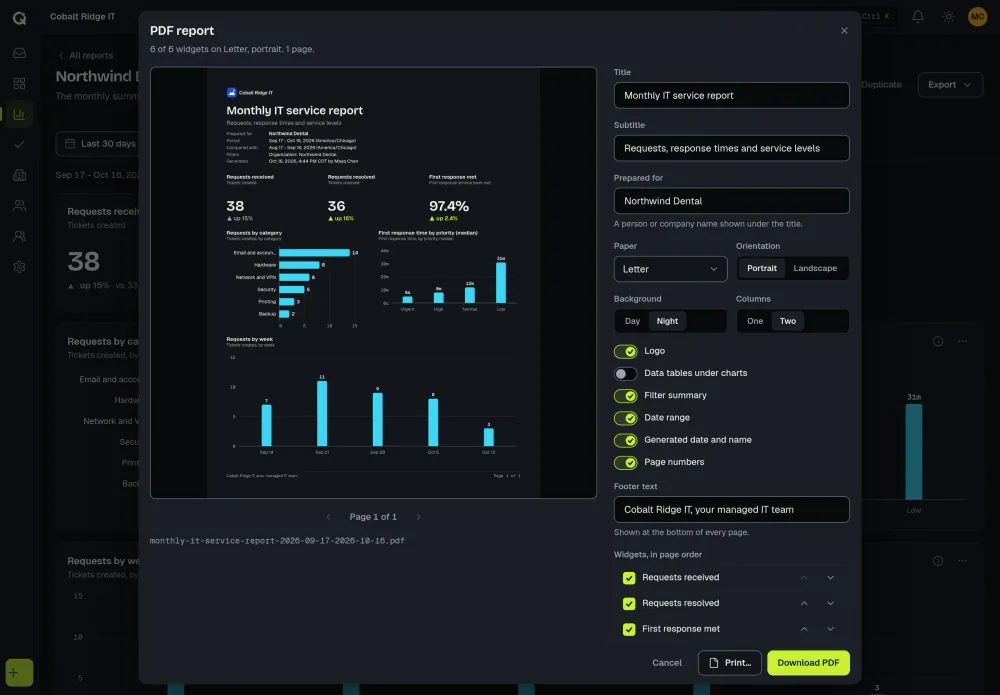
CSV downloads the data behind any widget. You can also download the underlying list of tickets, up to 10,000 rows, if your role may export tickets as well as reports.
The right numbers for each person
Reports run as the person viewing them. A report only counts the tickets that person can already open, so a shared report never shows anyone more than they could see in the queue.
Viewing, building, sharing and exporting reports are separate permissions that you can give to any role in Settings, and editing anyone’s shared report is a fifth. Owners and admins have all of them, agents can view, build and export, and Light agents can view. None of them changes who counts as a paid agent. Date ranges, days and weeks follow the time zone you set for the workspace, weeks start on Monday, and daylight saving days are counted correctly. Knowledge base views are counted by UTC day, and the report says so.
For MSPs
Filter any report to one client organization. The Client report template builds a month of volume, first-response SLA attainment and satisfaction for one organization, and the PDF export adds “Prepared for” and that organization’s name, so you can send it to the client yourself. More on the MSP help desk page.
What it costs
Nothing extra. Reports are in the one plan, which starts at $79.99 a month for 1 to 3 agents (see pricing). The SLA reports are fed by SLA management.
Questions
Does ActiveQ have reports and dashboards?
Yes. There are 19 ready-made reports, a builder with 30 metrics, saved and shared reports, and exports to PNG, PDF and CSV. A report is a dashboard: a grid of charts and tables with a date range and filters.
Can I build my own report?
Yes. Pick metrics, group and filter them, choose a chart for each, arrange the widgets, and save the result privately or for the whole workspace. Or copy a ready-made report and change it.
Can I export a report as a PDF or an image?
Yes, both. The PDF is laid out the way you want it, the PNG graphics come in the size, theme and palette you choose, and CSV gives you the data.
Who can see reports?
Anyone with permission to view reports, which owners, admins, agents and Light agents have by default. Each person sees numbers only for the tickets they can already open.
How reports work today
You open a report in the app and export it when you need it, as a PNG graphic, a PDF or a CSV file. Reports are not emailed on a schedule, and they have no hours or time-spent metrics. Clients cannot see reports in their portal, so your team exports a client report and sends it.
The builder works from a fixed list of 30 metrics, and you can’t group by custom fields. A PDF export is made in your browser as page images, so use the browser’s print option if you need a PDF whose text can be selected. Numbers can differ between people, because each person sees only their own tickets or their team’s if that is what their role allows.