Help desk metrics to track without a reporting suite
A small support team needs only a handful of numbers: first response time, resolution time, open backlog, volume by category and how many requests are reopened. Each can be tracked from a queue view and a spreadsheet, without a reporting suite, as long as you measure it the same way every time.
Start with the question, not the chart
A metric is useful only if it changes a decision. Before tracking a number, write down what you would do if it moved. If the answer is nothing, skip it. The five below each map to a decision a small team really makes.
The five metrics
- First response time
- The time from creation to the first reply from a person. It tells you if requesters feel heard. Decision: do we need more cover at certain hours? See the glossary for the definition choices.
- Resolution time
- The time from creation to resolved. Look at the median and at the slowest tenth, not only the average, because a few long cases can hide behind many easy ones. Decision: where do requests stall?
- Open backlog and its age
- How many requests are open now, and how many have been open longer than your normal resolution time. A growing, aging backlog is the earliest sign of overload. Decision: do we need help, or a clear-out?
- Volume by category
- How many requests arrive per week, split by category. Decision: which recurring problem would be cheapest to fix at the source, so the requests stop?
- Reopened requests
- How many resolved requests come back. A high share suggests that "resolved" is being set too early. Decision: do we need a confirmation step?
A weekly routine that takes twenty minutes
- Check the SLA at risk list first. Anything close to or past its target is today’s work, not a number to record.
- Count the open backlog, note the oldest few, and write both in a sheet with the date.
- Pull last week’s resolved requests and compute the median time from created to resolved and from created to first reply, noting any that were reopened.
- Tally categories. The top three are the weekly conversation: why do these keep arriving?
- Write one sentence on what changed and one decision. The sentence matters more than the numbers.
Getting the numbers out of ActiveQ
The Reports calculate first response and resolution time (median, average and 90th percentile), SLA attainment, backlog age, volume by category, reopen rate and satisfaction, so you do not need a spreadsheet; the rest of this guide works with any tool. Built-in queue views list unassigned, waiting, all open, recently resolved and SLA at risk tickets, with counts, which covers the backlog and the daily watch list. Each ticket shows the due time and state of its first response and resolution clocks, so you can see whether a target was met or breached.
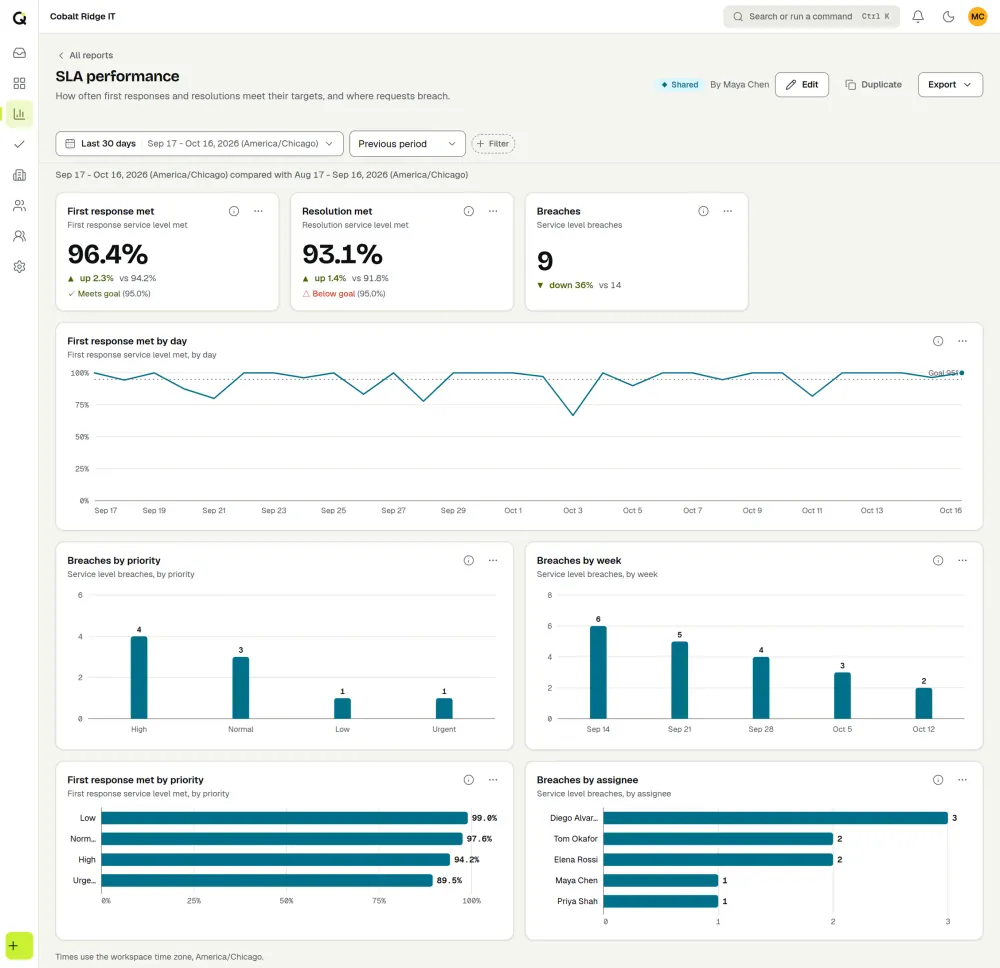
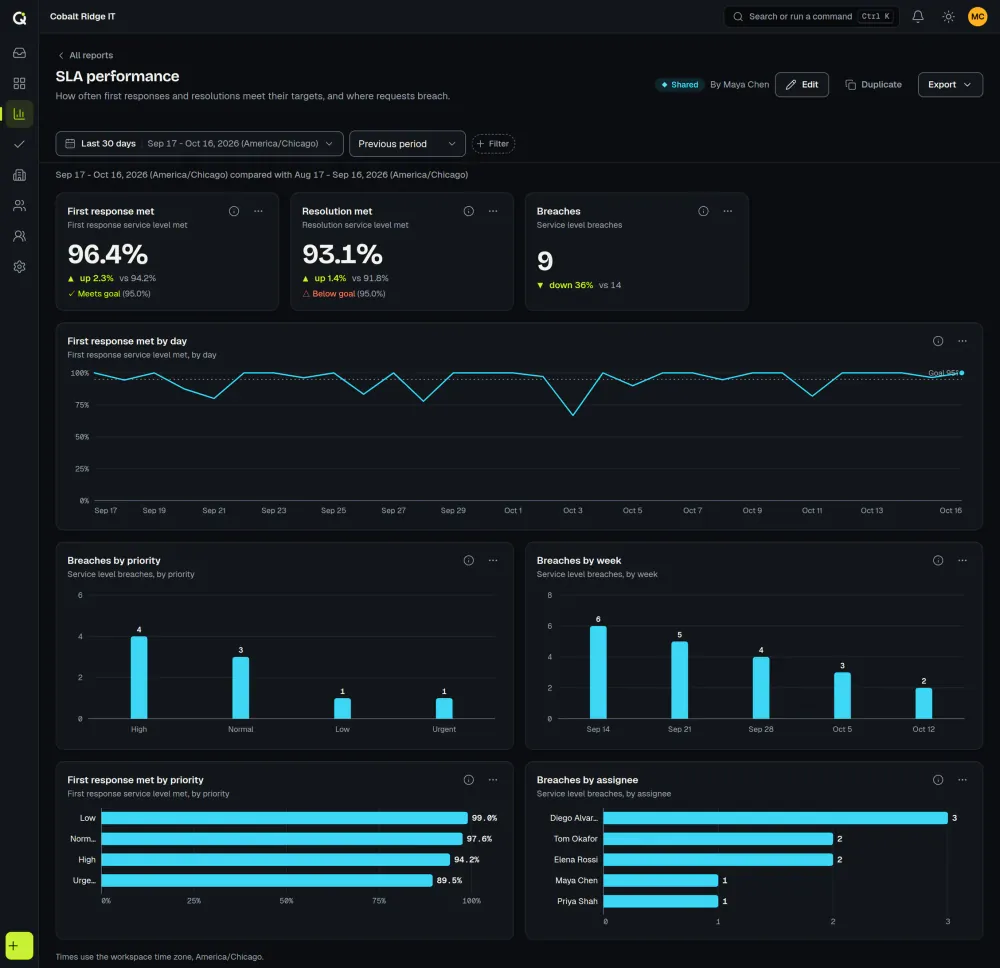
If you would rather script it, the API lists tickets with their created, first response, resolved and closed times and can filter by status, priority, team, organization and category, so a short script can fill a spreadsheet each week. SLA warning and breach events can also be sent to your own systems through webhooks as they happen, for example to post into a team channel.
Numbers to treat with care
- Tickets closed per technician. It rewards easy work and quick closes, and it punishes the person who takes the hard cases. Use it for planning, never for ranking.
- Averages alone. One outage can distort a week. Show the median beside the average.
- Satisfaction scores from a few answers. Low response rates make small samples swing. ActiveQ can email a one-click 1 to 5 rating link when a ticket is resolved, and the satisfaction report shows the average score, the share satisfied and the response rate. See the glossary entry on CSAT.
- A target met by changing the definition. If response time improves because the clock now pauses more often, requesters have not noticed anything.
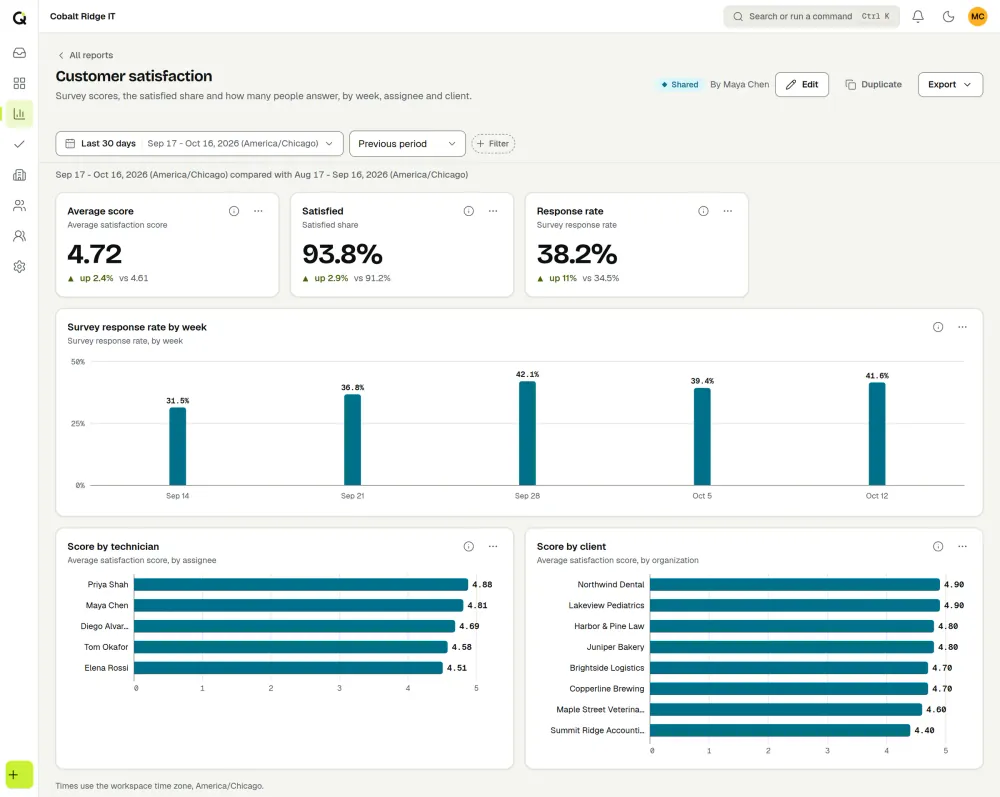
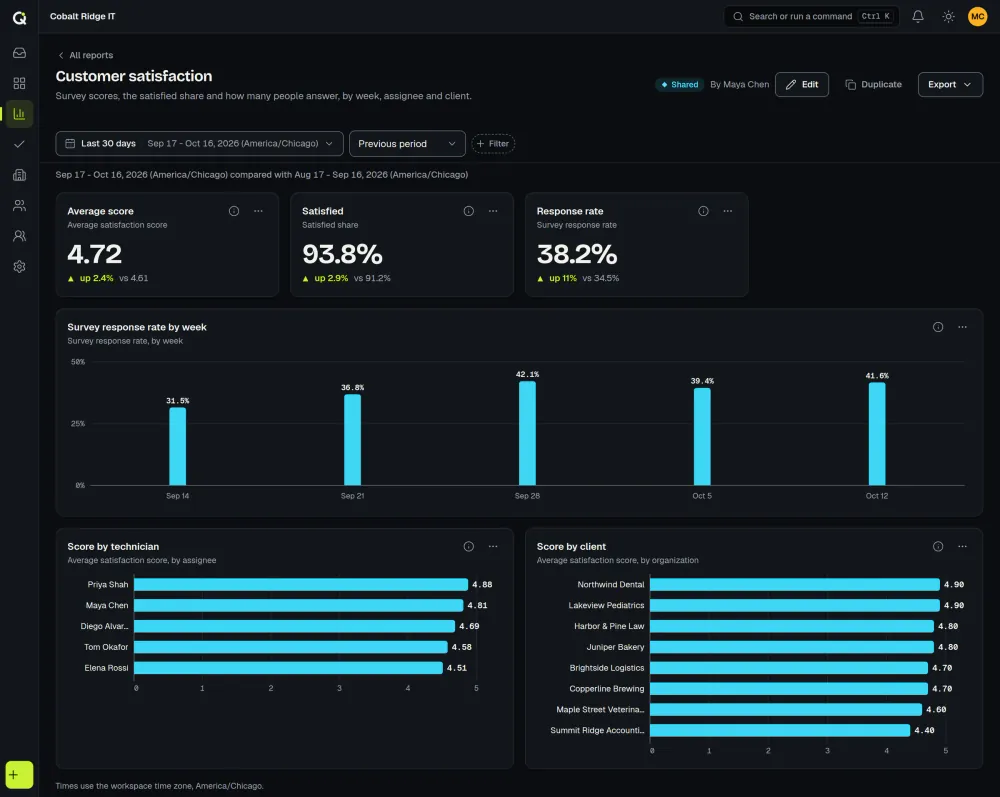
Precise definitions of each measure are in help desk metrics defined.